GISpipe
Epanet
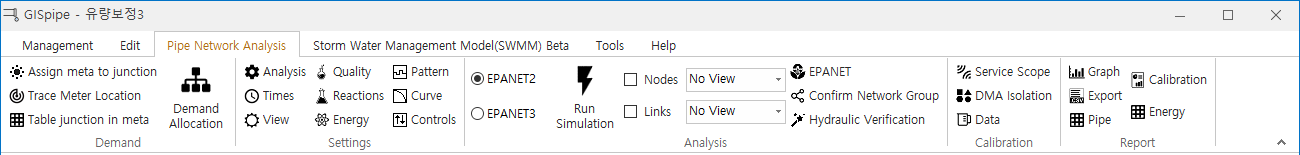
1 Demand
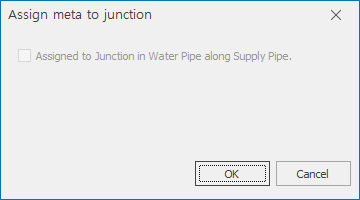
1.1 Assign meta to junction
- Ability to assign the customer number of the water meter to adjacent nodes.
- Button must be activated to have a meter layer.
- Required functions because of the assignment of Excel demand data to nodes.
- If there is a water supply line, follow the water supply line and the deck is assigned to the nodal point.
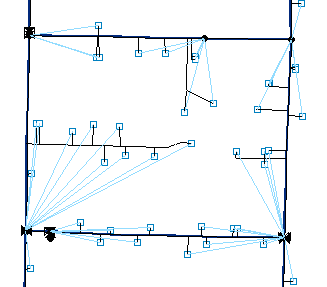
1.2 Trace Meter Location
- A function to show the position of the meter.
- Button must be active to have a meter layer.
- The map screen below shows the meter assignment location.
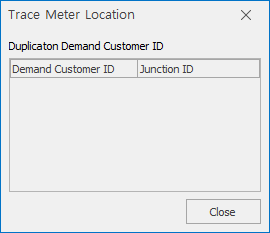
- If you want to change the assignment position, select it and drag it to the node you want to change.
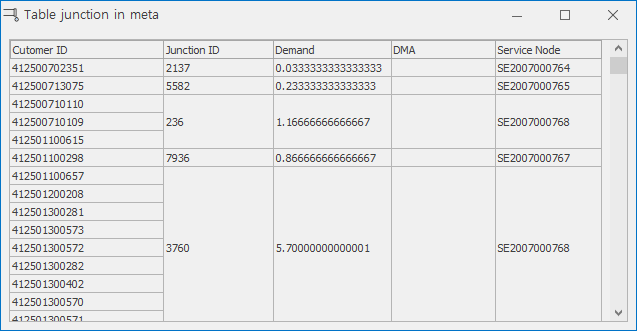
1.3 Table Junction In Meta
- The ability to see in the table which node the assigned number is assigned to.
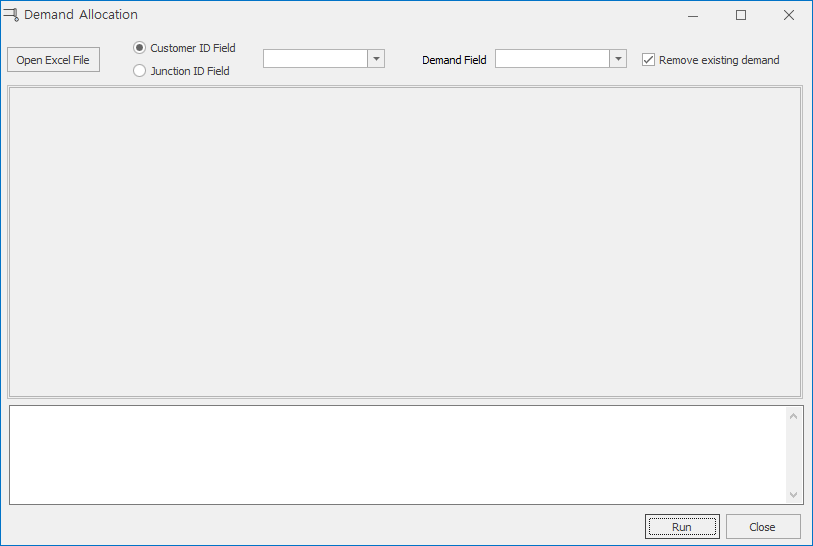
1.4 Demand Allocation
- Ability to assign Excel meter usage data to nodes.
2 Settings
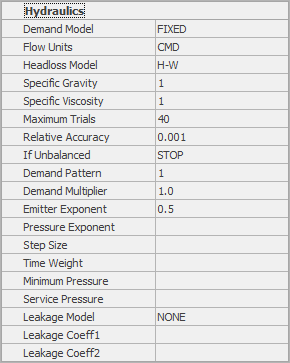
2.1 Analysis settings
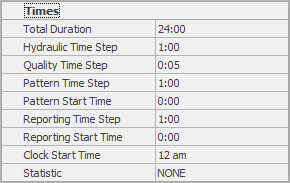
2.2 Time settings
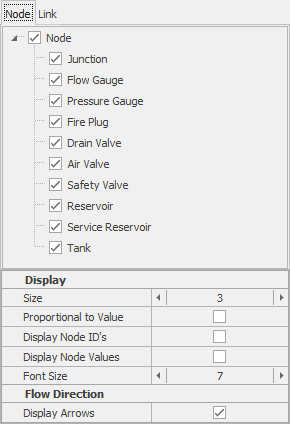
2.3 View Settings
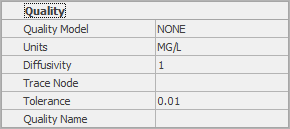
2.4 Quality setting
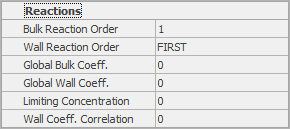
2.5 Reactions setting
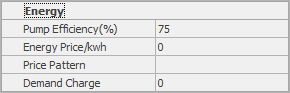
2.6 Energy setting
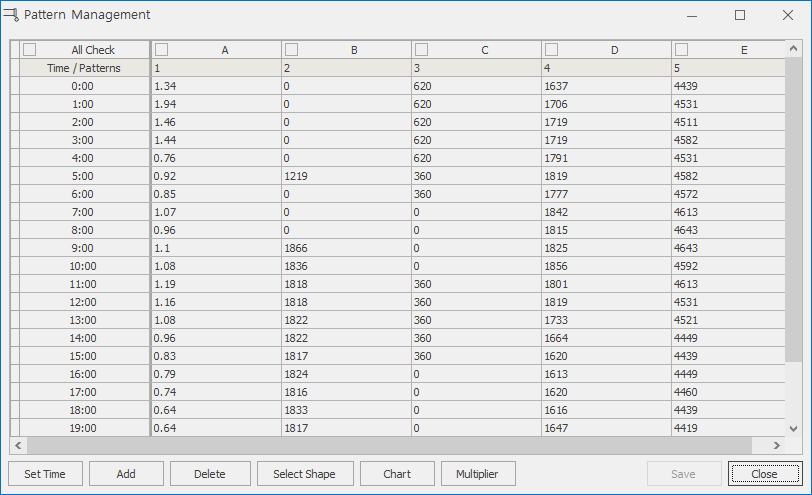
2.7 Pattern setting
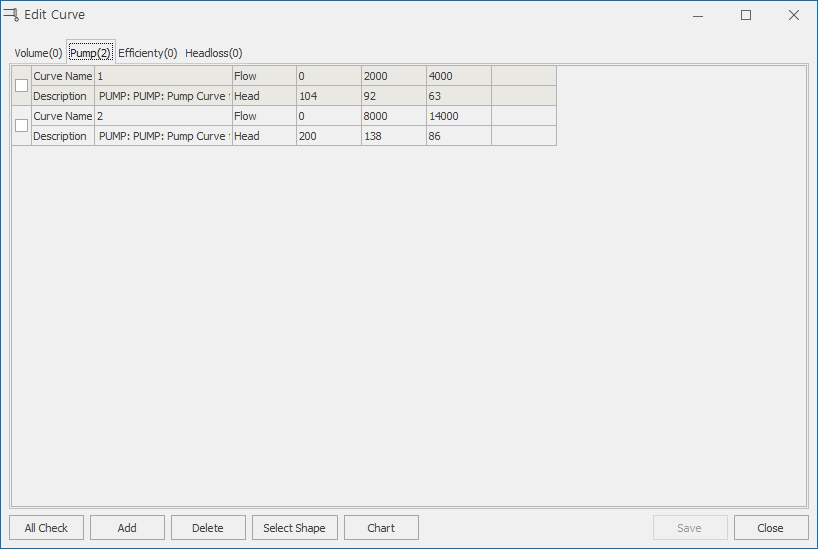
2.8 Curve setting
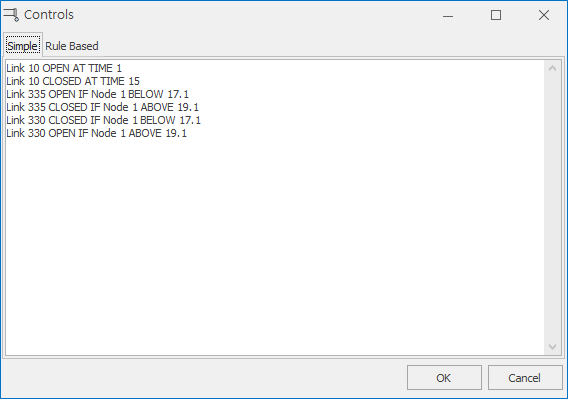
2.9 Controls setting
3 Analysis
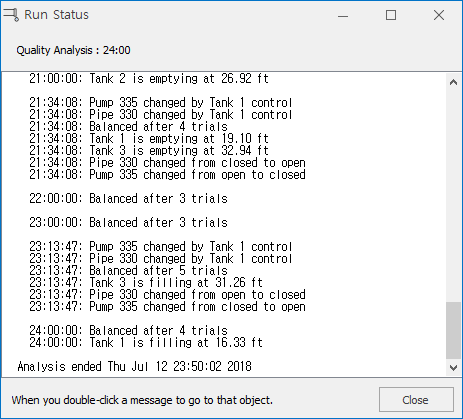
3.1 Run Simulation
- When you click the Execute Analysis button, the analysis results are shown as below.
3.2 View Nodes
3.3 View Links
3.4 EPANET
3.5 Check network group
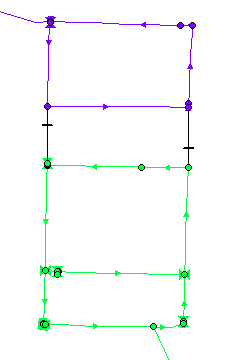
- It is a function that shows the separated network of networks by color.
3.6 Hydraulic verification
- It is a function that shows and corrects network errors.
3.6 Extended Period Simulation
- After setting the EPS and analyzing the network, the following grid appears.
- The light blue cell is the time at which the negative pressure occurred.
- Double clicking on the light blue cell will select the node where the negative pressure is generated on the map.

4 Calibration
4.1 Service Scope
- It is a function to check which reservoir water is supplied when there are several reservoirs.
- The picture below shows the water supply from the reservoir by color on the map screen.
4.2 DMA Isolation
- It is a function to find the entry point of the DMA.
5 Report
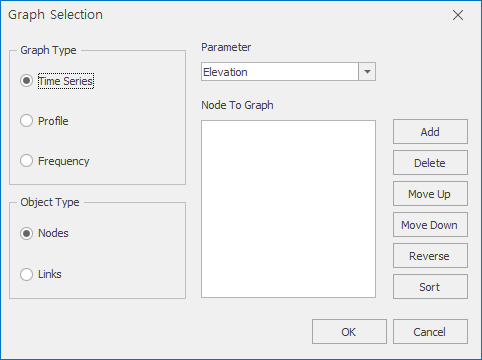
5.1 Graph
5.2 Export
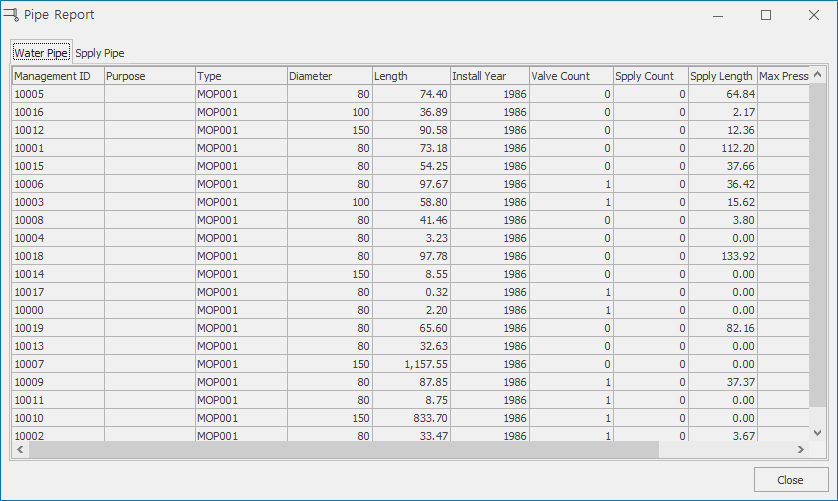
5.3 Pipe
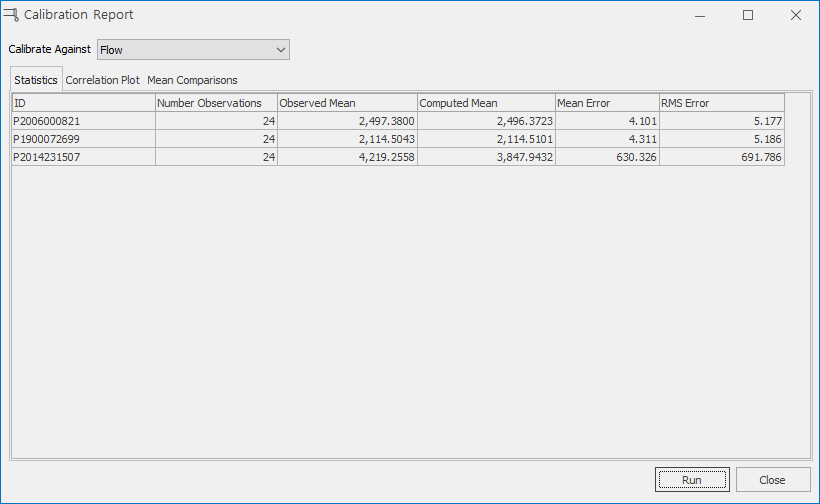
5.4 Calibration
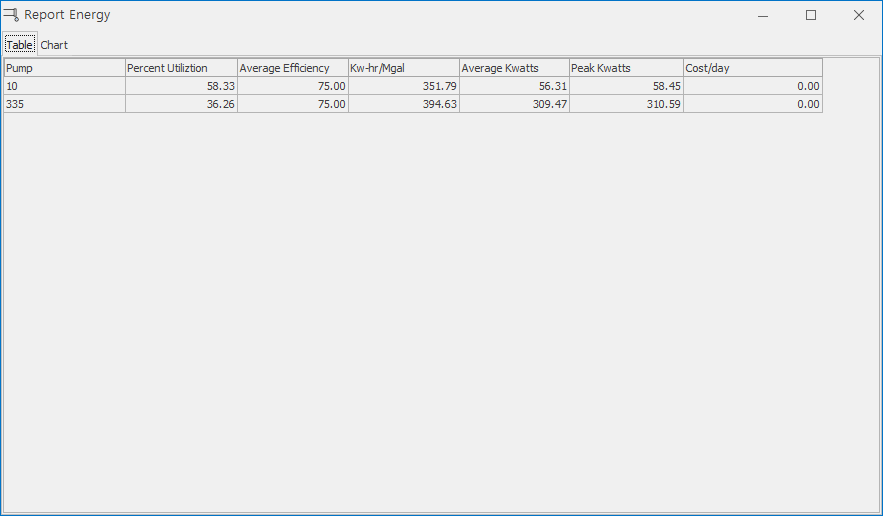
5.5 Energy